The S&P 500 Just Triggered a Rare Hourly Sell Signal. What Happens Next?
For nearly two months, the market rewarded one strategy above all others:
For nearly two months, the market rewarded one strategy above all others:
Buy the dip.
For nearly two months, the market rewarded one strategy above all others:
Buy the dip.
Every pullback was temporary. Every weakness attracted buyers. Every attempt by bears to regain control eventually failed.
That environment may be changing.
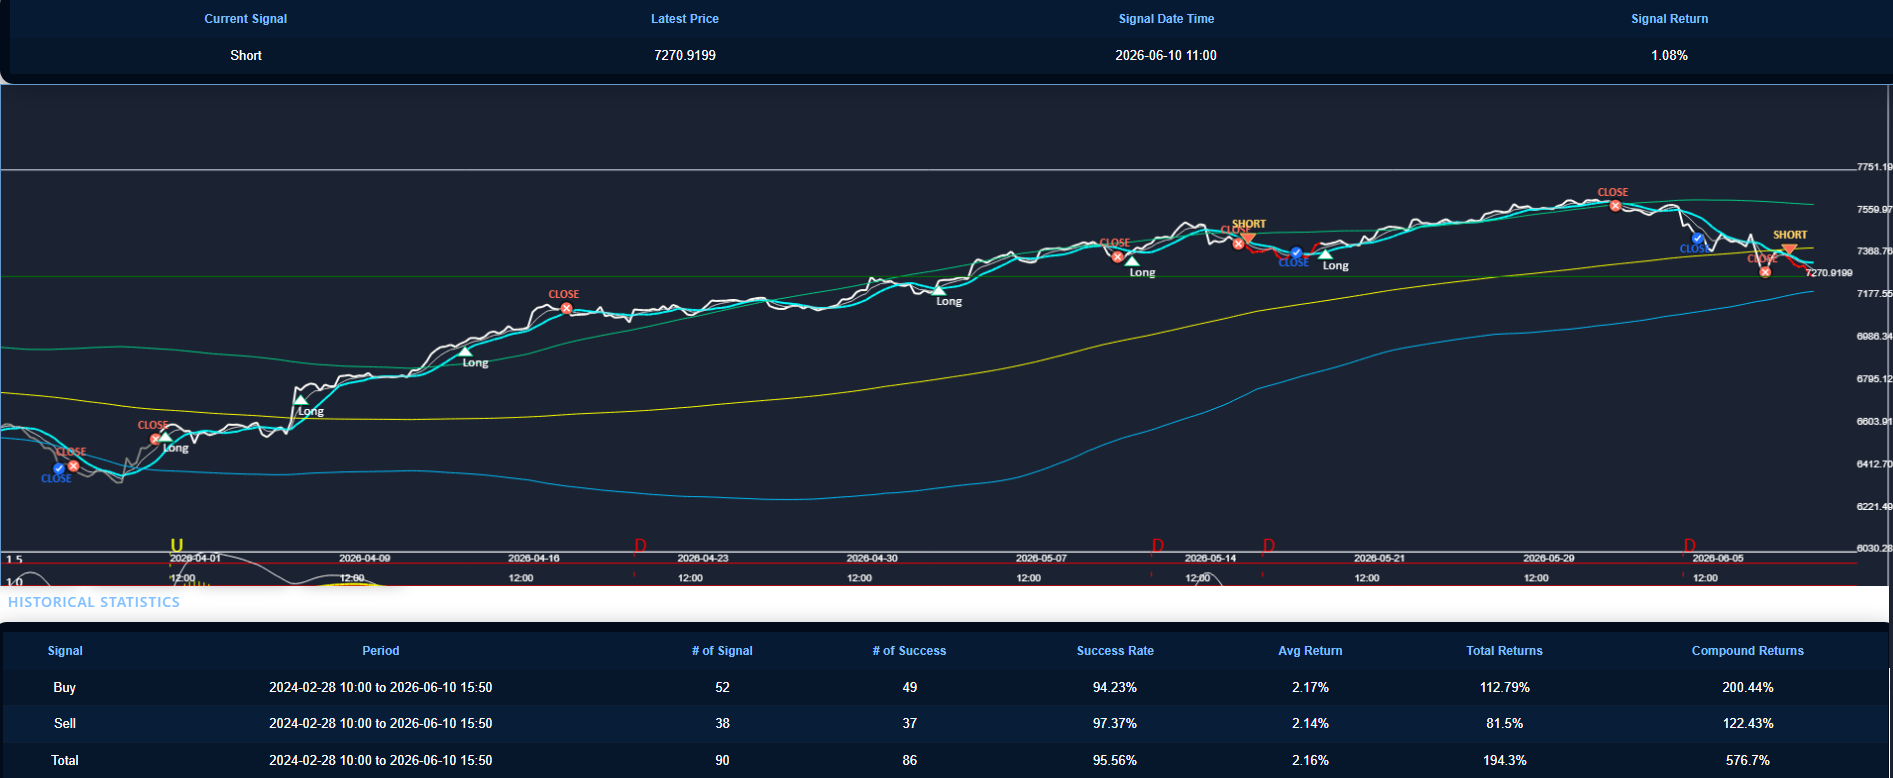
The latest hourly trend signal has now flipped bearish, ending one of the most persistent advances we’ve seen since the spring rally began.
The question investors should be asking is no longer whether the market is still strong.
The question is:
How much of the recent advance is now at risk?
Looking back at the rally from April through early June, the pattern was remarkably consistent.
Markets climbed steadily higher while remaining above short-term trend support.
Each correction was shallow.
Each recovery was swift.
Most importantly, buyers repeatedly defended key support zones before significant damage could occur.
Over the past week, however, something different emerged.
Instead of producing another successful rebound, the market began forming a sequence of:
Lower highs
Failed recoveries
Accelerating downside momentum
What initially looked like a routine pullback has now evolved into a confirmed breakdown of the hourly trend structure.
For the first time in weeks, rallies are being sold rather than bought.
That shift alone deserves attention.
Markets rarely transition from bullish to bearish in a single day.
The process usually begins with subtle changes beneath the surface.
The strongest rallies often occur when participation is broad and buyers remain aggressive.
As trends mature, leadership narrows.
Momentum weakens.
Recovery attempts become less convincing.
Eventually the market reaches a point where good news no longer generates meaningful upside.
The recent price action appears increasingly consistent with that pattern.
While the longer-term trend remains constructive, the short-term structure has clearly deteriorated.
And short-term weakness is often where larger corrections begin.
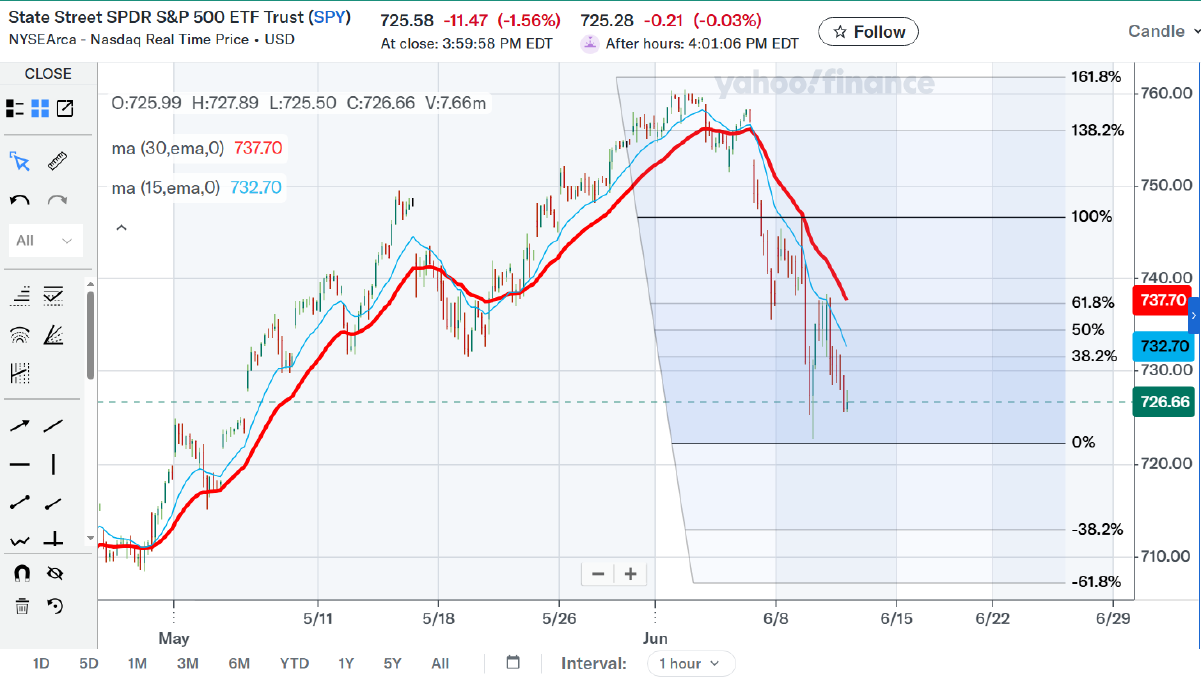
Using the recent swing structure, the market has already broken below a key retracement zone that previously acted as support.
That changes the discussion from “How deep is the pullback?” to “Where could the next support emerge?”
Several levels now stand out:
This area represents the nearest downside objective and the first location where buyers may attempt to stabilize the decline.
A short-term bounce would not be surprising here.
This corresponds closely with the 38.2% downside extension zone.
If selling pressure remains elevated and buyers fail to reclaim lost trend support, this becomes the next logical target.
This area aligns with a deeper Fibonacci extension and overlaps with the breakout region that launched much of the spring advance.
Should broader risk appetite continue deteriorating, this would become an important longer-term battleground between buyers and sellers.
No forecast is complete without identifying what would prove it wrong.
For bears, the challenge is straightforward.
The market must continue producing lower highs and lower lows.
If buyers quickly reclaim broken support levels and push price back above the declining short-term trend averages, the current breakdown could ultimately prove to be another temporary shakeout.
That scenario cannot be ruled out.
In fact, much of the past two months has conditioned investors to expect exactly that outcome.
The difference now is that the burden of proof has shifted.
For weeks, bulls controlled the narrative.
Today, they need to earn it back.
One bearish hourly signal does not automatically imply a bear market.
The longer-term trend remains upward sloping.
Many medium-term indicators still point toward a constructive backdrop.
However, successful investing often involves recognizing when conditions are changing before the headlines catch up.
The market’s message today is simple:
The powerful trend that carried stocks higher throughout April and May is no longer as healthy as it once was.
The first warning sign has already appeared.
The next several trading sessions will determine whether this becomes another brief pause in an ongoing bull trend—or the beginning of a much larger correction.
For now, caution is replacing complacency.
And that alone is worth paying attention to.